
مدونة
ELECTRICAL EQUIVALENT OF HEAT
Experiment No. 6:
Electrical Equivalent of Heat
The purpose :
to determine the amount of electrical energy that is equivalent to thermal energy
Warnings: Never apply power to the Heating Resistor unless the resistor is immersed in water. Never touch the resistor. It gets hot! Do not apply over 10 Volts.
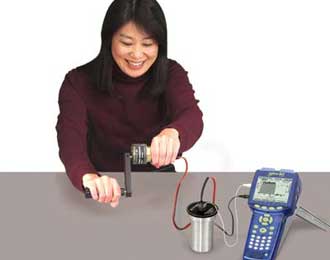
Equipments:
|
1 |
Energy Transfer-Calorimeter |
ET-8499 |
|
1 |
Hand Crank Generator |
EM-8090 |
|
1 |
Voltage/Current Sensor |
PS-2115 |
|
1 |
Temperature Sensor |
Included with GLX |
|
1 |
Fast-Response Temperature Sensor |
Included with GLX |
|
1 |
Mass Scale |
Digital |
Theory:
The purpose of this experiment can be accomplished by measuring the amount of electrical energy used in running the heating resistor and the resulting thermal energy added to the water. Also the number of Joules in one calorie is determined.
When heat is added to a solid or a liquid, that energy goes into increasing the materials internal energy, and thus increasing its temperature. The relationship between the heat and the resulting change in temperature is given by
Q = mcΔT
where Q = Heat, m =mass, c= specific heat and ΔT= change in temperature.
There are two things changing temperature in this experiment: The water and the aluminum calorimetry cup. The water and cup have different masses and specific heats, but we assume that they both have the same change in temperature.
In this experiment, heat is added to the calorimeter by the use of a heating resistor. Work is done by the students, turning the crank on an electrical generator which produces an electrical current.
The generated electrical energy is converted into heat in the resistor, increasing the temperature of the water and the cup. Historically, this has been referred to as the Electrical Equivalent of Heat.
Electrical Power is determined by the Voltage produced by the generator, and the resulting Current that is produced.
P = IV
where, I = Current through the resistor (Amps), V = Voltage across the resistor (Volts), and P = Power (Watts = Joules/sec).
Power is the rate at which energy is generated or used:
Power= Energy/time. Thus Energy can be calculated by
Energy = (Power)(time)
or in a case as with this lab where the power is not constant, Energy is the area under a Power vs. time graph.
Experimental Setup:
1. Plug the red lead from the generator into the (+) current terminal on the Voltage-Current Sensor.
2. Plug the red lead from the heating resistor into the (-) current terminal on the Voltage-Current Sensor.
3. Connect the black leads from the generator and the heating resistor together.
4. Plug the red voltage lead from the sensor into the (-) current terminal. Plug the black voltage lead from the sensor into the black lead coming from the heating resistor.
5. Plug a Fast Response Temperature Probe into the side of the GLX. The end of the probe can be fed down the open stopper hole. During the experiment, make sure the tip of the probe is down in the water, but not touching the heating resistor.
6. Plug the Voltage-Current Sensor into Port #1 on the GLX.
Procedure:
1. Open the Digits window on the GLX. This will allow you to read the ambient temperature of the room with the fast response temperature probe.
2. Measure the mass of the inner aluminum cup from the Calorimeter. Only the inner cup changes temperature and is part of the experiment. The outer (bigger) cup acts only as a holder, and due to the air gap in between, helps to insulate the inner cup.
3. Prepare some water that is about 5oC below room temperature. Add about 50 g of water to the inner cup. After the cup and water have come to equilibrium and you are ready to start the experiment, you will want the temperature to be about 3oC below room temperature.
4. Measure the mass of the cup plus water, and calculate the mass of the water.
5. Assemble the cup, using the spacer to suspend the inner cup inside the bigger cup. Put on the lid, and insert the heating resistor stopper in the hole. Insert the temperature probe in the stopper hole, making sure that the tip is under the water.
6. Check the temperature of the water again. If the water gets too warm before you can start, you can place the cup and water in an ice bath to cool it down. Wipe off any moisture on the cup before placing it back into the outer cup. If the water is too cold, you can use the generator to heat it, but don't overdo it! Gently swirl the cup to stir the water and wait for equilibrium before starting the data run.
7. Open the Graph window on the GLX. There should be two graphs: Power vs. Time and Temperature vs. Time. Start recording on the GLX.
8. Turn the crank in the positive direction (see label on the generator). Watch the power graph. Always stay below 10 Watts.
9. Every 15 seconds, gently swirl the calorimeter cup to mix the water.
10. Watch the temperature graph, and continue to crank until the water is about 3oC above room temperature. You can take turns cranking, and you do not need to try and keep the power constant. Do not stop recording.
11. After you have stopped cranking, continue to record data until the temperature has reached a plateau or is decreasing. Don't forget to swirl the water!
12. Stop recording.
Analysis:
1. Go to the Graphs menu (F4) on the graph and select Graph 2 (Temperature vs. Time). Use the Delta tool on the Tools menu (F3) to find the change in temperature, ΔT. Or go to the Table window (F2) and select maximum and minimum temperature from the Statistics menu.
2. Calculate the total amount of heat, Q, added to the water and the aluminum cup. Use the proper specific heat for each. Use specific heats in units of cal/goC so the heat will have units of calories. (cwater= 1.00 cal/goC and cAluminum= 0.215 cal/goC)
Q = QWater + QCup
Q = mcΔT
3. On the Graphs menu (F4), return to Graph 1. On the Tools menu (F3), select the Area tool (6). Find the area under the Power vs. time graph. This is the energy which was delivered to the water and the calorimeter cup.
4. Set the heat (in calories) equal to the energy delivered (in Joules). Calculate how many Joules are equivalent to one calorie. Look up the accepted value and calculate the percent difference between it and your answer.
—————
المدونة الأولى
Our new blog has been launched today. Stay focused on it and we will try to keep you informed. You can read new posts on this blog via the RSS feed.